2022Q1 Quarterly Client Letter
Dear Clients,
Ukraine Donation Challenge
I’ve never publicized this but our company gives away approximately 10% of our revenues each year to charitable causes. In our last e-mail newsletter, we announced a $10,000 donation challenge to benefit Ukraine. I will match any donations to any charitable organization helping Ukraine up to $10,000 total. I’m happy to say that we have already matched $2,500 in donations so far and made our first donation of $2,500 to Save the Children.
You can give to a charity of your choice. If you are unsure, below is a list of charities or organization helping Ukraine that I have seen listed in multiple mainstream media publications as reputable (or recommended by Ukrainians).
We will be splitting our matching donations equally amongst: Nova Ukraine, Red Cross, Save the Children (done! – $2500 donated), and Doctors Without Borders. However, as I said before you can donate to any organization you wish, listed below or not listed, it’s up to you.
Humanitarian – Ukraine based Organizations
Nova Ukraine: https://novaukraine.org/
Razom Ukraine: https://razomforukraine.org/
Sunflowers of Peace: https://www.facebook.com/sunflowerofpeace/
Humanitarian – Global Organizations
International Committee of the Red Cross: https://www.icrc.org/en/where-we-work/europe-central-asia/ukraine
Doctors Without Borders: https://www.doctorswithoutborders.org/what-we-do/countries/ukraine
Save the Children: https://www.savethechildren.org/us/where-we-work/ukraine
Military
Ukraine Ministry of Defense: https://bank.gov.ua/en/news/all/natsionalniy-bank-vidkriv-spetsrahunok-dlya-zboru-koshtiv-na-potrebi-armiyi
Come Back Alive: https://www.comebackalive.in.ua/
Now on to the market and the economy.
Market and the Economy
The stock market started the year down and been fluctuating between being down only a few percent to as much as 12% at one point.
The main issue causing the market volatility is inflation and interest rates with a side order of the war in Ukraine, potential of another COVID strain, and continued supply chain issues contributing as well.
The market being concerned about something isn’t new; on average the stock market will be negative for the year, have a drop of 10%, and a few drops of 3-5%. As people say the market is continually climbing a “wall of worry” and while interest rates and inflation are short term issues, I don’t think they represent any long-term concerns. Let’s go over both of the market concerns in detail.
Interest Rates
After lowering interest rates to zero to help the economy during COVID, the Federal Reserve has now begun the process of raising rates. The Fed’s goal is to return things to normal now that COVID is starting to wane and also to help fight inflation. I’m ambivalent about how much raising rates will help tame inflation.
On one hand normalizing interest rates should help cool the housing market and return things to normal at least in regards to home prices and home price appreciation. There still may be issues with housing supply as some building materials still have availability issues.
On the other hand, there are some cases where prices are not tied to interest rates. For instance, Ukraine is a significant exporter of agricultural good and other goods. It supplies almost 15% of the world’s cereal grains (particularly wheat), iron and steel, and food oil (particularly sun flower oil). No matter what the Federal Reserve does with moving interest rates, it’s not going to affect the root cause of the supply issue: the war.
However, even if the Federal Reserve makes a mistake in raising rates to try to combat other forms of inflation not linked to interest rates, I believe things will turn out fine.
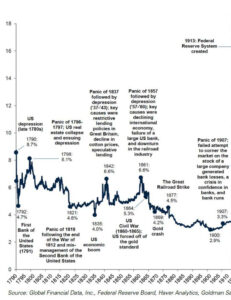
The Fed is bringing rates up from zero. That means there is a lot of room to raise rates and still be in the range considered normal. Even raising rates 50 basis points at each quarterly meeting, it would still take several years before interest rates were considered extremely high. Below is a graph of interest rates since the late 1700s. The first part of the chart shows rates form 1790 to the creation of the Federal Reserve in 1913.
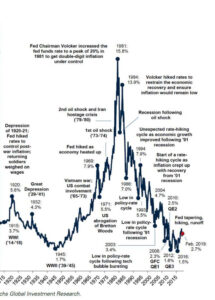
The chart on the following column shows rates from 1913 until 2019 (prior to COVID). Right now rates are at .25%.


We can see that there is substantial room for interest rates to rise and still be even below the long-term normal range. In fact, if you look closely (which you may not be able to do since the chart has been scaled down to fit on the page) you’ll notice that rates have risen by a percent or more twice during the current long term post-2008 bull market. Indeed, the stock market usually throws an initial temper-tantrum over rates rising before the market recovers and continues moving higher.
Inflation
The second big issue affecting the market is inflation. As I said previously some inflation issues, like home price appreciation, can be tied to interest rates but many are still COVID related.
For example, even in 2022 we are still seeing lockdowns or COVID related closures interfere with supply chains. In April, Shanghai and other cities in China have begun to implement lockdowns again. This has impacted everything from shipping to products themselves (for example about half the 200 components of a typical iPhone are manufactured in or near Shanghai). As long as COVID is still around we will still have periodic supply chain issues.
However, there is good news on the supply-demand side for goods versus services. A lot of the inflation we’ve seen over the past year(s) has result from a 1-2-3 punch of COVID spending habit changes, supply chain issues, and stimulus spending. Afraid (a valid fear to be sure) of COVID job loss induced recessions many governments responded with massive, perhaps poorly targeted (although to be fair time was a factor) in some instances stimulus measures. Consumers as a whole were now flush with cash but because of COVID many services, especially travel and leisure were shutdown. Thus, consumers spent on the only thing available – goods. Of course, with COVID causing supply chain issues and periodic manufacturing closures goods production couldn’t keep up with demand.
We are continuing to see the ratio of consumer spending on goods to services track towards its historical average. Goods spending has been falling while services spending (eating out, travel, etc.) has continued to rise. Once the ratio is back to normal, we should see inflation pressure start to slow. In fact, we may be starting to see some of it already as used car prices have now fallen two months in a row and TSA screening numbers (a good proxy for travel and services spending) are now close to 2019 levels.
2022 Performance to Date
For the first quarter of 2022, all market returns have been negative so far. The US stock market returned -5.37%, Foreign Developed Market stocks returned -6.04%, and Emerging Market returned -6.4%.
By contrast most bond markets were slightly negative for the year with the exception of inflation protected bonds.
US Stock Market: -5.37%
Foreign Developed Market: -6.04%
Emerging Markets: -6.4%
US Total Bond Market: -5.94%
International Government Bonds: -4.79%
Investment Grade Corporate Bonds: -6.96%
Inflation Protected Bonds: -4.4%
Real Estate: -5.97%
(All the returns listed are those of the ETFs we use.)
Because all client portfolios are individuals your portfolio will contain a combination of most or all the investments listed as well as others, so its performance will be different. Please see your statements for your exact portfolio details.
Reminder
Although you are all familiar with my investment management and retirement planning services, I want to take time in this newsletter to remind you of the other financial services I offer.
These services are available to clients as part of their comprehensive fee. I work with clients to build monthly budgets, help pick the best credit card offer, and give advice on their existing company retirement plans. Almost anything related to finance or money is something I’m available to help you with. I’ve even helped clients with non-financial things, such as picking out a new car. I enjoy helping clients, so please do not hesitate to give me a call. Shoot me an email or text if there is any way I can be of assistance.
How is ben invested?
Here is how my personal portfolio (my SEP IRA at FOLIO Institutional) is positioned for 2022.
My investment breakdown is as follows:
- 31% in our Capital Appreciation Folio
- 32% in our Concentrated Stock Folio
- 31% in our Aggressive Growth ETF Portfolio
- 1% in Real Estate (Vanguard Real Estate Index, VNQ)
- 1% in Emerging Market Stocks (Vanguard Emerging Market Index, VWO)
- 1% in Investment Grade Bonds (Vanguard Total Bond Market Index, BND)
- 1% in Inflation Protected Bonds (Barclays iShares TIPS Index, TIP)
- 1% in Municipal Bonds (iShares S&P National AMT-Free Municipal Bond Index, MUB)
- 1% in International Investment Grade Bonds (Vanguard Intermediate Term International Bond Index, BNDX)
As you can see, I have a stock-heavy portfolio. I believe our strategies for investing offer the best opportunity for long-term wealth creation.
Note: I also have an older IRA account opened during grad school. That account is invested in one stock, Philip Morris International (PM).
Sincerely,

Performance Disclosure:
The performance data presented prior to 2011 represents a composite of all discretionary equity investments in accounts that have been open for at least one year. Any accounts open for less than one year are excluded from the composite performance shown. From time-to-time clients have made special requests that SIM hold securities in their account that are not included in SIMs recommended equity portfolio, so those investments are excluded from the composite results shown. Performance is calculated using a holding period return formula, reflects the deduction of a management fee of 1% of assets per year, and reflects the reinvestment of capital gains and dividends.
Performance data presented for 2011 and after represents the performance of the model portfolio that client accounts are linked too, reflects the deduction of management fees of 1% of assets per year, and reflects the reinvestment of capital gains and dividends.
The S&P 500 and Dow Jones Developed Market Index are used for comparison purposes and may have a significantly different volatility than the portfolios used for the presentation of SIM’s returns. The term “global stocks” refers to the Vanguard Total World Stock ETF (VT).
A copy of our most recent Form ADV Part 2A and Part 2B is available upon request.
