2022Q4 Quarterly Client Newsletter
Dear Clients,
The year 2022 was eventful in the markets. It was the first significantly negative year for stocks since 2008. (Both 2015 and 2018 had only slight negative returns.) Not only was the market down for the year, but it also had extreme daily volatility with lots of big up or down moves. For instance, the Nasdaq gained or lost 2% or more in a single day 84 times during the year, the highest volatility since 2002!
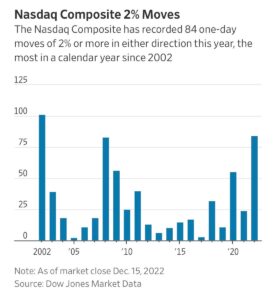
There are only 252 trading days in a year, so that means one-third of the time the market was moving up or down by 2% or more!
Against this back drop, you’d think there would be significant economic upheaval, but that wasn’t the case. Inflation was high, peaking during the summer, but it began to trend down in the latter half of the year.

Although inflation is still high, it is trending in the right direction and starting to drop at an accelerated rate. Additionally, many of the COVID-era inflation drivers are fading, especially major components like auto prices and rent.
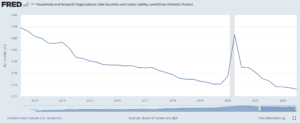
Outside of inflation, it’s hard to find any major negative economic data points. The chart below shows household debt compared to the size of the economy for the past decade. Ignoring the crazy COVID-era data spike, household debt has been falling and continues to decrease. No signs of a bubble here.

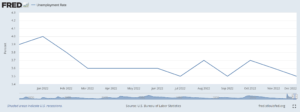
Despite a lot of worrying headlines about the job market, job openings are still well above their pre-COVID levels. Also, though anecdotally, many of my business owner friends and clients are still cautiously expanding.
We don’t expect to see any major increases in unemployment. While we have seen some headline-making layoffs in the technology sector, it’s important to remember the sector’s recent history. A lot of technology companies and work-from-home type businesses massively over-hired during COVID. While Facebook’s 11,000-person layoff or Microsoft’s 10,000-person reduction sounds like a large number, Facebook added over 30,000 employees during 2020 and 2021. That means, the company still has 19,000 more employees now than it did before COVID. Likewise, Microsoft added almost 40,000 employees during the COVID years, leaving the company still up almost 29,000 employees from the pre-COVID era.
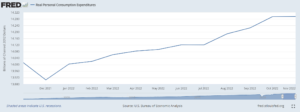
Finally, consumer spending, the linchpin of the economy, is still doing well with no signs for concern in the major economic data.
It’s worth noting that during the year, the Federal Reserve raised rates from 0% to 4.25% without a major negative impact. Mortgage rates went from 3%, or slightly below 3%, up to 6.5% and briefly approached 7%, again without large negative results. If monetary policy was going to have a big effect on the economy, we would have seen it by now.
Outside the real estate and auto loan markets, the truth is the Fed just doesn’t have much impact on the economy. Yes, raising rates can slow real estate and auto sales. But at the same time higher interest rates mean more income for savers and retirees (or anyone who holds bonds, cash, and CDs). In the end, interest rate changes tend to have muted effects because slowing in one area is balanced by growth in another.
While 2022 wasn’t a pleasant year in the markets, we are seeing more positive signs as we start 2023. Inflation is slowing. The Fed is slowing the pace of rate hikes and even talking about pausing hikes. I think we will see the market recover when inflation returns to the 2-3% target rate and the Fed stops hiking rates. It’s a dynamic situation. I’m hesitant to make a prediction, but I think we may see recovery in the back half of 2023. Meanwhile, I’d prepare to weather similar volatility in the first half of 2023 as we saw in 2022. This time, you’ll know that we are beginning to return to normal inflation and interest rates while the economy is still going along fine.
2022 Performance
For 2022 all market returns were negative. Real estate performed the worst while bond funds performed the best, even though they were all down around 12% to 13%.
US Stock Market: -19.44%
Foreign Developed Market: -15.39%
Emerging Markets: -18.04%
US Total Bond Market: -13.12%
International Government Bonds: -12.75%
Investment Grade Corporate Bonds: -13.98%
Inflation Protected Bonds: -12.13%
Real Estate: -26.21%
(All the returns listed are those of the ETFs we use.)
Because all client portfolios are individuals your portfolio will contain a combination of most or all the investments listed as well as others, so its performance will be different. Please see your statements for your exact portfolio details.
Reminder
Although you are all familiar with my investment management and retirement planning services, I want to take time in this newsletter to remind you of the other financial services I offer.
These services are available to clients as part of their comprehensive fee. I work with clients to build monthly budgets, help pick the best credit card offer, and give advice on their existing company retirement plans. Almost anything related to finance or money is something I’m available to help you with. I’ve even helped clients with non-financial things, such as picking out a new car. I enjoy helping clients, so please do not hesitate to give me a call. Shoot me an email or text if there is any way I can be of assistance.
How is Ben Invested?
Here is how my personal portfolio (my SEP IRA at FOLIO Institutional) is positioned for 2023.
My investment breakdown is as follows:
- 25% in our Capital Appreciation Folio
- 25% in our Concentrated Stock Folio
- 44% in our Aggressive Growth ETF Portfolio
- 1% in Real Estate (Vanguard Real Estate Index, VNQ)
- 1% in Emerging Market Stocks (Vanguard Emerging Market Index, VWO)
- 1% in Investment Grade Bonds (Vanguard Total Bond Market Index, BND)
- 1% in Inflation Protected Bonds (Barclays iShares TIPS Index, TIP)
- 1% in Municipal Bonds (iShares S&P National AMT-Free Municipal Bond Index, MUB)
- 1% in International Investment Grade Bonds (Vanguard Intermediate Term International Bond Index, BNDX)
As you can see, I have a stock-heavy portfolio. I believe our strategies for investing offer the best opportunity for long-term wealth creation.
Note: I also have an older IRA account opened during grad school. That account is invested in one stock, Philip Morris International (PM).
Sincerely,

Performance Disclosure:
The performance data presented prior to 2011 represents a composite of all discretionary equity investments in accounts that have been open for at least one year. Any accounts open for less than one year are excluded from the composite performance shown. From time to time clients have made special requests that SIM hold securities in their account that are not included in SIMs recommended equity portfolio, so those investments are excluded from the composite results shown. Performance is calculated using a holding period return formula, reflects the deduction of a management fee of 1% of assets per year, and reflects the reinvestment of capital gains and dividends.
Performance data presented for 2011 and after represents the performance of the model portfolio that client accounts are linked too, reflects the deduction of management fees of 1% of assets per year, and reflects the reinvestment of capital gains and dividends.
The S&P 500 and Dow Jones Developed Market Index are used for comparison purposes and may have a significantly different volatility than the portfolios used for the presentation of SIM’s returns. The term “global stocks” refers to the Vanguard Total World Stock ETF (VT).
A copy of our most recent Form ADV Part 2A and Part 2B is available upon request.