2023Q4 Quarterly Client Newsletter
January 2024
Dear Clients,
For 2023, the market rebounded 26%, bringing it close to an all-time high by the end of the year. The ride, however, was a bumpy one.
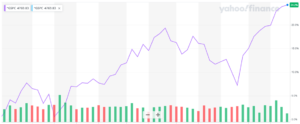
We had a period where the market was almost negative, with more than a few 5% drops and a big 10% drop near year end. It’s not unusual for the market go up and down like this. Small 5-10% drops are a regular occurrence even during good years!
In additional good news, as we have moved into 2024, the US stock market has now moved past previous all-time highs.
Although the tech-heavy NASDAQ index, international stocks, and the bond market are still below all-time highs.
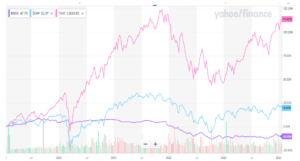
International stocks and the NASDAQ (the top line in the chart) are about 12% away from all-time highs, and the broad bond market (the bottom line in the chart) is about 16% away. For clients with stock-heavy portfolios or portfolios with stocks and individual bonds, your accounts should be approximately back to where they were at the start of 2023.
For clients with more bond funds or tech-heavy portfolios, you’ll still be a few percentage points away from previous highs.
Outlook for 2024
The good news for bonds is that we’ve seen inflation slow significantly from its highs.
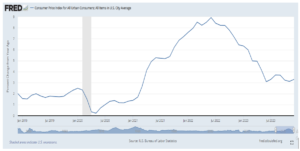
Since inflation growth is returning to its normal rate of approximately 2% annually, the Federal Reserve has signaled they may start cutting rates later this year. Falling rates mean bond prices rise; that is, bonds that were bought back when interest rates were higher are now worth more. Therefore, bond funds should do well when rate cuts start.
Other important economic indicators like retail sales and jobs data remain strong.
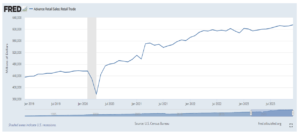
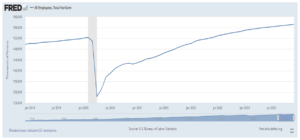
This means that corporate earnings, which over the long term are the primary driver of sustainable stock market growth, should continue to grow. Growing corporate earnings should help some of the stock markets indices like the NASDAQ and international stocks catch up and regain their all-time highs.
Encouragingly, we’ve seen corporate earnings grow 4.6% the last quarter, which was the first time in three quarters that corporate profits grew. Starting in 2022 and into 2023, we had three quarters of falling corporate profit growth, mainly due to inflation pressures on profit margins. Revenues grew during that time, but so did costs because of inflation. That shrunk profit margins, and this was the main reason why despite not technically experiencing a recession it took so long for the market to come back.
The good news is that the Fed is done hiking rates, inflation continues to moderate, and corporate earnings are growing again. These are good reasons to be optimistic into 2024.
2023 Performance Review
For 2023 all asset classes had positive returns. Stocks returned anywhere from 26% to 9% and bond returns ranged from a bit below 4% to almost 9%.
US Stock Market: 26.11%
Foreign Developed Market: 18.01%
Emerging Markets: 9.35%
US Total Bond Market: 5.7%
International Government Bonds: 8.75%
Investment Grade Corporate Bonds: 8.98%
Inflation Protected Bonds: 3.81%
Real Estate: 11.79%
(All the returns listed are those of the ETFs we use.)
Because all client portfolios are individual, your portfolio will contain a combination of most or all the investments listed as well as others, so its performance will be different. Please see your statements for your exact portfolio details.
Sincerely,
Ben Strubel
Performance Disclosure:
The performance data presented prior to 2011 represents a composite of all discretionary equity investments in accounts that have been open for at least one year. Any accounts open for less than one year are excluded from the composite performance shown. From time to time clients have made special requests that SIM hold securities in their account that are not included in SIMs recommended equity portfolio, so those investments are excluded from the composite results shown. Performance is calculated using a holding period return formula, reflects the deduction of a management fee of 1% of assets per year, and reflects the reinvestment of capital gains and dividends.
Performance data presented for 2011 and after represents the performance of the model portfolio that client accounts are linked too, reflects the deduction of management fees of 1% of assets per year, and reflects the reinvestment of capital gains and dividends.
The S&P 500 and Dow Jones Developed Market Index are used for comparison purposes and may have a significantly different volatility than the portfolios used for the presentation of SIM’s returns. The term “global stocks” refers to the Vanguard Total World Stock ETF (VT).
A copy of our most recent Form ADV Part 2A and Part 2B is available upon request.
